The Lone Star tick has caught the public eye with its reported meat allergy and geographical spread. But how much of a danger is the tick really? Should patients be afraid of this new health hazard? Not tremendously, according to the Lone Star tick map and data below.
It’s true that the Lone Star tick can cause a meat allergy, but with about 1,500 cases in the last nine years nationwide, the fear is more visceral than logical. (Consider that over 20,000 people a year die of the flu.) Ehrlichiosis is the worst disease spread by the tick, and according to CDC data, it affects less than six people in 1,000 each year. Further, according to the Lone Star tick maps and figures, the tick’s area is spreading very slowly if at all.
There are about ten times more reported cases of the prominent Lone Star tick disease than there were 20 years ago, but it’s hard to tell whether actual incidence is also increasing.
Lone Star Tick Map 2017
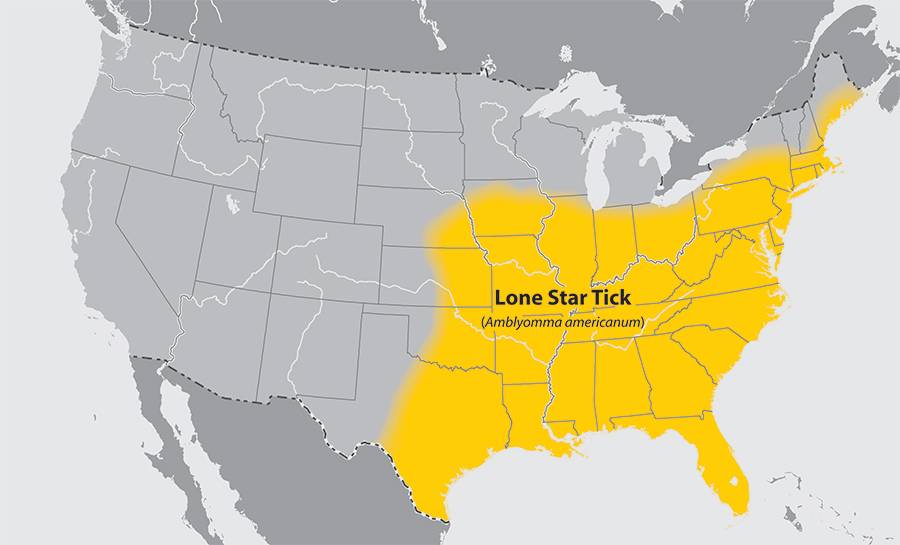
This Lone Star tick map from the U.S. Centers for Disease Control (CDC) shows the tick’s geographical region. The name “Lone Star Tick” has little or no relation to any special risk in the state of Texas. In fact only about 2/3 of that state is affected, with the name referencing the white dot on the tick’s back.
The Lone Star tick’s geography stretches from the Western half of Texas, as far North as Northeastern Nebraska and as far East as Eastern Maine. Despite a sudden, massive surge in the interest surrounding the tick, there’s no evidence that its geographical footprint has spread in recent years. (See below.)
Lone Star Tick Map (Previous Years)
Lone Star tick maps from 2011 through 2017 from the CDC show no increase in the tick’s geographical area. In fact, the CDC has used the same image for the map each year since it first posted a map on its website in 2011. (We culled the maps below from CDC archives.)
This doesn’t mean the tick’s area of inhabitance isn’t spreading. It may just mean that the CDC hasn’t yet updated its map. However, certain environmental factors from elevation to concurrent species to rainfall data to prey (wild turkeys) would suggest the tick’s area would grow slowly if at all.
[table width =”100%” style =”” responsive =”true”]
[table_head]
[th_column]Lone Star Tick Map 2011[/th_column]
[th_column]Lone Star Tick Map 2012[/th_column]
[th_column]Lone Star Tick Map 2013[/th_column]
[/table_head]
[table_body]
[table_row]
[row_column][thumbnail target=”_self” src=”https://www.medprodisposal.com/wp-content/uploads/2017/06/Lone-Star-Tick-Map-2011-1.jpg”][/row_column]
[row_column][thumbnail target=”_self” src=”https://www.medprodisposal.com/wp-content/uploads/2017/06/Lone-Star-Tick-Map-2012.jpg”][/row_column]
[row_column][thumbnail target=”_self” src=”https://www.medprodisposal.com/wp-content/uploads/2017/06/Lone-Star-Tick-Map-2013.jpg”][/row_column]
[/table_row]
[/table_body]
[/table]
[table width =”100%” style =”” responsive =”true”]
[table_head]
[th_column]Lone Star Tick Map 2014[/th_column]
[th_column]Lone Star Tick Map 2015[/th_column]
[th_column]Lone Star Tick Map 2016[/th_column]
[/table_head]
[table_body]
[table_row]
[row_column][thumbnail target=”_self” src=”https://www.medprodisposal.com/wp-content/uploads/2017/06/Lone-Star-Tick-Map-2014.jpg”][/row_column]
[row_column][thumbnail target=”_self” src=”https://www.medprodisposal.com/wp-content/uploads/2017/06/Lone-Star-Tick-Map-2015.jpg”][/row_column]
[row_column][thumbnail target=”_self” src=”https://www.medprodisposal.com/wp-content/uploads/2017/06/Lone-Star-Tick-Map-2016.jpg”][/row_column]
[/table_row]
[/table_body]
[/table]
In fact there have been reports of cases of ehrlichiosis and meat allergy as far North as Northern Minnesota, though those are extremely rare and may be travel-related.
Lone Star Tick Disease Map
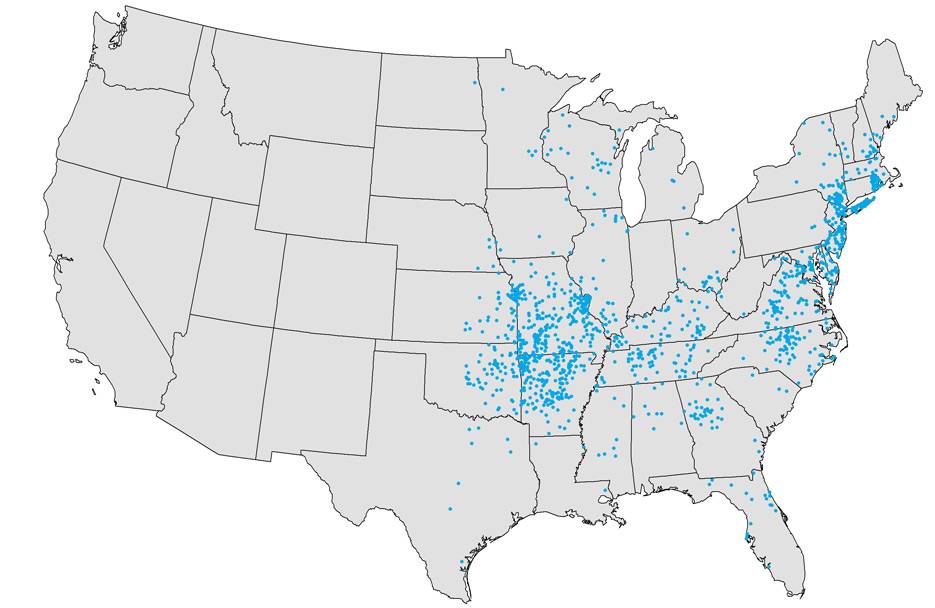
This CDC map shows approximate cases of ehrlichiosis (the most serious Lone Star tick disease) by state. It’s a little more useful than the Lone Star tick map above, since it shows concentrations of actual cases of the diseases caused by the tick.
To some extent the map below just follows population concentrations within the tick’s geographical area. However that’s not the case everywhere. For instance, several heavily populated areas of Florida, Michigan, Pennsylvania, Indiana, and Ohio remain relatively unaffected. At the same time, areas of Arkansas, Missouri, and Oklahoma with fairly low human populations suffer from disproportionately high numbers of cases.
One caveat to the data above is that reporting of Lone Star tick disease (ehrlichiosis) cases might be better in some areas than others. In reality, there may be just as many ticks (and just as much disease) in areas that look “safe” on the map.
Lone Star Tick Diseases
The Lone Star tick spreads several diseases. Though the list below looks scary, most ticks transmit multiple pathogens. For instance, the blacklegged tick serves as a vector for four known illnesses. That said, it’s known only for Lyme disease thanks to the prevalence of that condition and subsequent media coverage.
The Lone Star tick is the main vector for monocytic ehrlichiosis and granulocytic ehrlichiosis. Those are the two “main” Lone Star tick diseases, with others transmitted by other ticks as well.
- Monocytotropic Ehrlichiosis
- Granulocytic Ehrlichiosis (canine and human)
- Tularemia
- Southern Tick-Assoicated Rash Illness (STARI)
- Lyme Disease (extremely unlikely from this tick)
- Heartland Virus (eight cases confirmed from this tick nationwide)
Cases of Lone Star Tick Disease by Year
What the Lone Star tick maps above don’t show is whether the tick is spreading. The ehrlichiosis cases by year chart below gives info on the increase of reported cases at a glance. It’s very easy to make the see the steep slope depicted in the graph and conclude that we’re being overrun by Lone Star ticks and the diseases they carry. However, it’s important to remember that ehrlichiosis is relatively new in terms of data.
Ehrlichiosis, the main Lone Star tick disease, was identified as a reportable disease in 2000. Even then, knowledge of the disease was not widespread, and many thousands of cases have almost certainly gone undiagnosed.
As data and understanding surrounding the Lone Star tick grows, reported cases of the tick will naturally grow as well. This doesn’t mean actual cases aren’t growing rapidly as well. It just means we have imperfect data still.
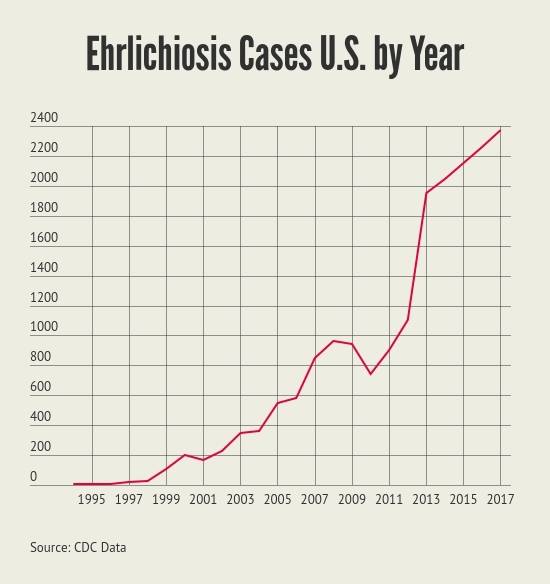
The data above for 2012 through 2017 are extrapolated based on the average 5% growth per year in cases of the disease from 1994 through 2011. The table below shows approximate numbers of cases of the most prominent Lone Star tick disease (ehrlichiosis) since 1994.
[table width =”100%” style =”” responsive =”true”]
[table_head]
[th_column]Year[/th_column]
[th_column]Ehrlichiosis Cases U.S.[/th_column]
[/table_head]
[table_body]
[table_row] [row_column] 1994 [/row_column] [row_column] 10 [/row_column] [/table_row]
[table_row] [row_column] 1995 [/row_column] [row_column] 5 [/row_column] [/table_row]
[table_row] [row_column] 1996 [/row_column] [row_column] 10 [/row_column] [/table_row]
[table_row] [row_column] 1997 [/row_column] [row_column] 20 [/row_column] [/table_row]
[table_row] [row_column] 1998 [/row_column] [row_column] 30 [/row_column] [/table_row]
[table_row] [row_column] 1999 [/row_column] [row_column] 110 [/row_column] [/table_row]
[table_row] [row_column] 2000 [/row_column] [row_column] 200 [/row_column] [/table_row]
[table_row] [row_column] 2001 [/row_column] [row_column] 170 [/row_column] [/table_row]
[table_row] [row_column] 2002 [/row_column] [row_column] 230 [/row_column] [/table_row]
[table_row] [row_column] 2003 [/row_column] [row_column] 350 [/row_column] [/table_row]
[table_row] [row_column] 2004 [/row_column] [row_column] 360 [/row_column] [/table_row]
[table_row] [row_column] 2005 [/row_column] [row_column] 550 [/row_column] [/table_row]
[table_row] [row_column] 2006 [/row_column] [row_column] 580 [/row_column] [/table_row]
[table_row] [row_column] 2007 [/row_column] [row_column] 850 [/row_column] [/table_row]
[table_row] [row_column] 2008 [/row_column] [row_column] 961 [/row_column] [/table_row]
[table_row] [row_column] 2009 [/row_column] [row_column] 944 [/row_column] [/table_row]
[table_row] [row_column] 2010 [/row_column] [row_column] 740 [/row_column] [/table_row]
[table_row] [row_column] 2011 [/row_column] [row_column] 900 [/row_column] [/table_row]
[table_row] [row_column] 2012 [/row_column] [row_column] 1100 [/row_column] [/table_row]
[table_row] [row_column] 2013 [/row_column] [row_column] 1950 [/row_column] [/table_row]
[table_row] [row_column] 2014 [/row_column] [row_column] 2,048 [/row_column] [/table_row]
[table_row] [row_column] 2015 [/row_column] [row_column] 2,150 [/row_column] [/table_row]
[table_row] [row_column] 2016 [/row_column] [row_column] 2,257 [/row_column] [/table_row]
[table_row] [row_column] 2017 [/row_column] [row_column] 2,370 [/row_column] [/table_row]
[/table_body]
[/table]
Lone Star Tick Meat Allergy
The Lone Star tick meat allergy has garnered a lot of attention from the media and the general public. In June of 2017, stories of the allergy hit the internet. Just a few days later, interest in the tick skyrocketed. That’s despite only about 1,500 total cases of the allergy in the entire country since 2008, a rate of about 167 cases per year, or about six cases per state in the tick’s map area.
By contrast, over 20,000 people a year die from the flu. Fear of the Lone Star tick meat allergy is, in other words, on the same level as fear of sharks after watching Jaws. It’s visceral, it’s creepy and scary, but there’s no data-driven reason to be nervous.
How Big is the Lone Star Tick?
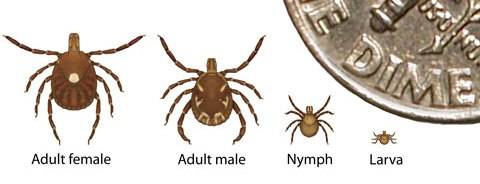
The Lone Star tick is tiny. Only a few millimeters across. The image below from the CDC shows the adult female and male ticks and nymphs compared to a dime.The size of the Lone Star tick when engorged is varies, but is generally a little smaller than a little bigger than Lincoln’s head on a penny.
Is the Lone Star Tick Spreading?
Data on Lone Star ticks doesn’t run as deep as for some other ticks like the blacklegged (lyme disease) tick. That makes it hard to determine whether (or how fast) the Lone Star tick is spreading across the map.
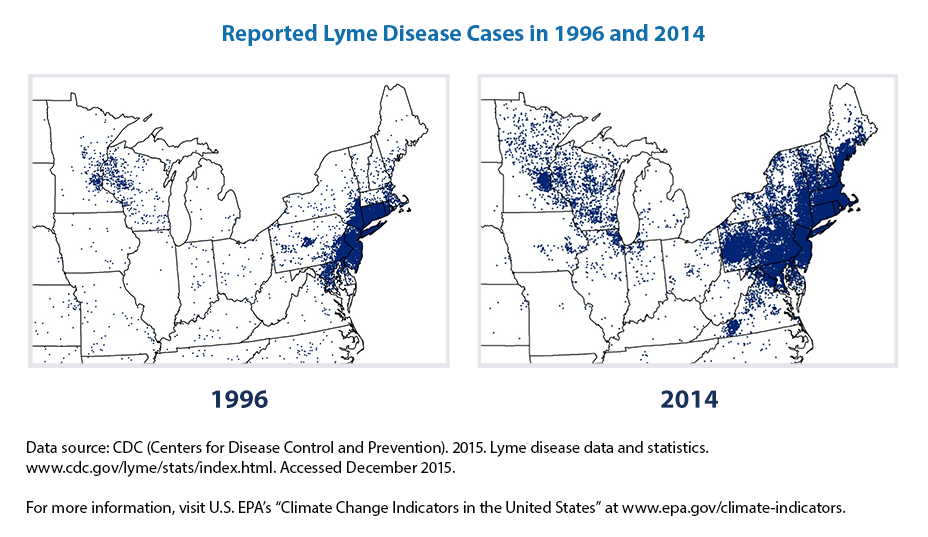
Lyme disease was first identified as a distinct disease in 1975. By contrast, the main Lone Star tick disease (ehrlichiosis) wasn’t named as a reportable disease until 2000. Since we don’t have good data on whether the tick’s map area is growing, we can look at the spread of Lyme disease for a clue. The idea is that the same environmental factors that contribute to the spread of Lyme disease (and its tick vector) may have a similar effect on the Lone Star tick and the illnesses it plays host to. See the map below for the severity of Lyme spread in the past decade.
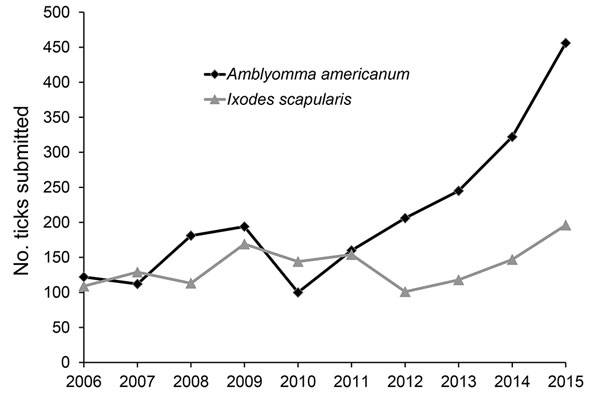
Local Evidence of the Spread of Lone Star Ticks
The graph below points to an increase in Lone Star ticks in a localized area. It shows a sharp increase in the number of ticks submitted to Monmouth County New Jersey’s Tick Identification Service. The black line shows Lone Star Ticks submitted through 2015, while the grey line shows blacklegged (Lyme disease) ticks. This graph suggests a very real increase in the Lone Star tick population in that area, since there shouldn’t be any bias in terms of which ticks get brought into the program.
Lone Star Tick Symptoms
The Lone Star tick can transmit several diseases. The most prevalent (about 2,000 cases a year in 2011) are various forms of ehrlichiosis (monocytotropic and granulocytic). Symptoms of ehrlichiosis show up within 7-14 days of a tick bite, where the tick is attached for at least 24 hours. Symptoms include:
- Headache
- Fever
- Aches
- Chills
- Vomiting
- Nausea
- Fatigue
- Joint pain
- Loss of appetite
- Rash
- Cough
- Confusion
In other words, flu-like symptoms, or symptoms similar to Lyme disease or anaplasmosis. Definitive diagnosis requires a blood test for either ehrlichiosis genes or antibodies, or both..
How to Remove a Lone Star Tick
According to the CDC, all ticks (including Lone Star ticks) should be removed with fine-tipped tweezers. The key point is not to squeeze the tick’s body and not to break off the mouth parts.
Use the tweezers to grip the tick as close to the skin as you can. Then pull the tick away from the skin using even, steady pressure. Never jerk or twist the tick, since this can break the mouth parts off in the skin, which can lead to infection.
Don’t squeeze the tick’s body, since this can re-inject blood from the tick back into your body.
Afterward, clean your skin and hands with rubbing alcohol. Then immerse the tick in rubbing alcohol or flush it down the toilet. Never crush ticks with your fingers, since this can expose you to pathogens.
Never wait for a tick to detach and never try to get it to detach by painting it with petroleum jelly or nail polish. The goal is to get it off as fast as possible.
What About Very Small Lone Star Ticks
Lone Star tick larvae can be so small they’re barely visible to the naked eye. While these ticks can bite through human skin, the good news is that larvae aren’t infected with disease-causing pathogens. Looking for and finding any poppy-seed-sized Lone Star ticks attached to your skin will prevent almost all disease.
Conclusion
The Lone Star tick has caught the public imagination, thanks to its ability to transmit a meat allergy to its victims. With about 5 cases of this allergy per year in each state where the tick is active, fear of the meat allergy is largely unfounded. Reports of the spread of the tick aren’t borne out by the Lone Star Tick map shown by the CDC in 2011 through 2017, or by the ehrlichiosis disease map. That said, confirmed cases of ehrlichiosis spread by the tick have increased on average 5% per year since 1994. With nearly 2,000 cases in 2013. If the trend has continued, we should expect around 2,300 cases nationwide in 2017.
Save Money on Medical Waste Disposal
While you’re brushing up on Lone Star tick statistics and maps, why not look into saving money on medical waste disposal? See why more and more private practices and clinics choose MedPro Disposal’s reliable service and predictable prices. To find out how much you could be saving right now, see this handy savings calculator.